The visualization of key figures or processes can be realized in conzept 16 with different objects. Depending on the application, there may also be a requirement to draw simple geometric shapes such as lines, circles or rectangles. This was previously not possible…
In order to be able to implement this requirement, there will be a new surface object from the upcoming conzept 16 version. This can be used to create the following shapes:
- Rectangles
- Squares
- Circles
- Ovals
- Lines
The basis for drawing graphic objects is the canvas object, a surface for drawing or creating vector-based graphic objects. In the current version, the “canvas” and the graphic objects to be drawn are created exclusively at runtime. In a later version, the canvas object will be included in the object palette of conzept 16 Designer.
All objects have attributes that can be used to determine the appearance. These include, for example, selection of the font, color and line width of the frame or the fill color. It is even possible to use a background image.
Positions and sizes are specified in logical coordinates, analogous to the conzept 16 print objects. This has the advantage that the display is based on device-independent units (e.g. millimetres or centimetres).
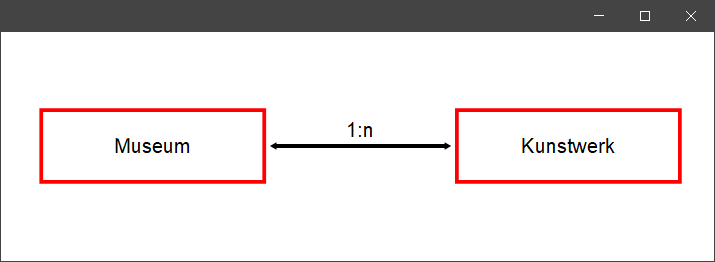
In the following example, the relationship between the entities “museum” and “artwork” is mapped using the canvas object.
define
{
  // Conversion into logical units
  mLogRect(l,t,r,b,u) : RectMake(PrtUnitLog(CnvFI(l),u),PrtUnitLog(CnvFI(t),u),PrtUnitLog(CnvFI(r),u),PrtUnitLog(CnvFI(b),u))
}

sub CreateGraphic
(
  aCvs      : handle;
  aType     : int;
  aCaption  : alpha;
  aRect     : rect;
)

local
{
  tCvg  : handle;
  tFont : font;
}

{
  // Create graphic object
  tCvg # WinCreate(_WintypeCanvasGraphic,'','',aCvs);

  switch (aType)
  {
    // Create graphic object
    case _WinFormTypeRectangle : tCvg->wpBorderColFg # _WinColLightRed;

    // Display the start and end point of the line as an arrow
    case _WinFormTypeLine  :
    {
      tCvg->wpLineCapStart # _WinLineCapArrowAnchor;
      tCvg->wpLineCapEnd   # _WinLineCapArrowAnchor;
    }
  }
  // Shape of the object
  tCvg->wpFormType # aType;

  // Font size
  tFont # tCvg->wpFont;
  tFont:size # 150;
  tCvg->wpFont # tFont;

  // Labeling
  tCvg->wpCaption # aCaption;

  // Position
  tCvg->wpArea # aRect;
}

// Create artboard
tCvs # WinCreate(_WinTypeCanvas,'','',tFrm);
// Graphic object of the type “Rectangle”
tCvs->CreateGraphic(_WinFormTypeRectangle,'Museum',mLogRect(1,2,7,4,_PrtUnitCentimetres));
// Graphic object of the type “Line”
tCvs->CreateGraphic(_WinFormTypeLine,'1:n',mLogRect(7,2,12,4,_PrtUnitCentimetres));
// Graphic object of the type “Rectangle”
tCvs->CreateGraphic(_WinFormTypeRectangle,'Kunstwerk',mLogRect(12,2,18,4,_PrtUnitCentimetres));
Conclusion:
Processes can be illustrated particularly well using images and diagrams. Complex processes in particular can be analysed and understood more easily using virtualization. In addition to the conzept 16 objects such as GanttGraph, Chart and Picture, the Canvas object is another building block for professional process visualization, as is typically used in dashboard and cockpit solutions.
We have added a sample application to the code library with which the graphical objects can be created and the properties of the objects defined.