
Picture and MetaPicture objects allow the conzept 16 developer to display graphics of different file formats in the user interface. Over the course of time, however, the objects have been expanded to include many functions, so that the application possibilities are not limited to the pure display of images, as the following article will demonstrate.
Introduction
The Picture object is used to display raster graphics. Popular representatives of this type are TIFF, JPEG or PNG files. The MetaPicture object, on the other hand, displays vector graphics. The WMF and EMF file formats are supported here. These offer the advantage over raster graphics that they can be scaled without loss.
An interesting feature of Picture and MetaPicture is that Picture and MetaPicture objects can be subordinated to the objects.
Overlays
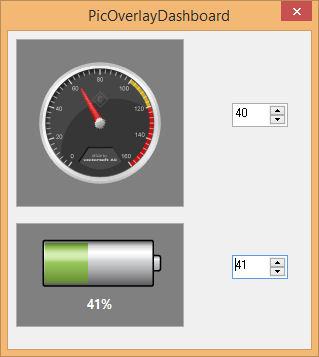 Fig.1: Application of overlays
The subordinate Picture and MetaPicture objects are referred to as overlays, as they are superimposed on the superordinate main image. The example ‘PicOverlayDashboard’ in the CodeLibrary shows this using the example of a speedometer and a charge status display (Fig. 1).
The speedometer needle is represented by an overlay which is superimposed on the main image (the speedometer). The rotation of the speedometer needle is achieved by the wpRotation property of the overlay. The situation is similar with the battery indicator: the green bar is the overlay.
Like the superordinate main image, overlays also offer the option of displaying text. The wpTextLabel property exists for this purpose. Text color and position can also be adjusted (Related blog article: Grafische Darstellung von Kennzahlen).
Graphs
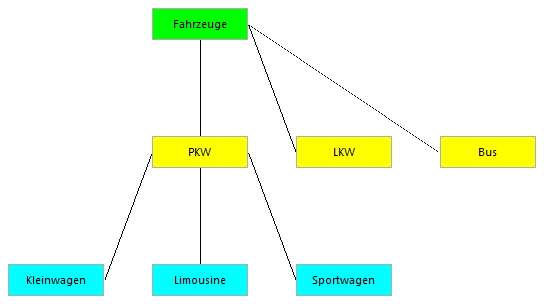 Fig.2: The graph
The following is an example of how this can be used to create a simple graph consisting of boxes (the nodes) and lines (the connections between the nodes) (Fig. 2). The graph itself is represented by a picture object, which contains the box and line objects in the form of overlays.
The graph library
The graph library (database at the end of the article) essentially consists of the ‘GraphLib’ procedure. This implements the three components Graph, GraphBox and GraphLine and provides corresponding functions for their creation and use. The procedure ‘GraphLib.Include’ contains a few macros that are required to call the functions provided.
GraphBox
An instance of a GraphBox object is generated with the ‘GraphBox.Create’ function.
sub GraphBox.Create
(
  aTitle           : alpha;   // Text to be displayed
  opt aPosGridLeft : int;     // Position left side of the box (default = 0)
  opt aPosGridTop  : int;     // Position top side of the box (default = 0)
  opt aWidthGrid   : int;     // Width of the box (default = 6)
  opt aHeightGrid  : int;     // Height of the box (default = 2)
)

: handle;
The function is given a title for the text to be displayed and the coordinates of the box. These are transferred in raster coordinates for easier positioning. One raster point corresponds to 16 pixels. The size was chosen arbitrarily and can be adjusted in the ‘GraphLib.Include’ procedure. The height and width of the box are also specified in grid coordinates. All position and size specifications are optional.
Sometimes it is more practical if the position of one box can be specified relative to another. The ‘GraphBox.MoveToBox’ function is available for this purpose.
sub GraphBox.MoveToBox
(
  aGraphBoxToMove   : handle;   // Box to be positioned
  aGraphBox         : handle;   // Box to be positioned relative to
  aPosMode          : int;      // Mode
  opt aDistanceGrid : int;      // Distance in grid coordinates (default = 0)
)
The argument aPosMode specifies whether the box (aGraphBoxToMove) should be positioned to the left, right, above or below the specified box (aGraphBox). The optional argument aDistanceGrid specifies how many grid units should be moved.
The ‘GraphBox.SetMouseEvent’ function is used to react to mouse clicks by the user.
sub GraphBox.SetMouseEvent
(
  aGraphBox      : handle;    // Box
  aEventFunction : alpha;     // Event function
)
{ aGraphBox->WinEvtProcNameSet(_WinEvtMouse,aEventFunction); }
This forwards all mouse inputs to the specified event function.
In addition to the functions mentioned above, there are others for setting and reading the display text and the fill color.
GraphLine
The ‘GraphLine.Create’ function exists to create a connection. It has no arguments and only returns the generated descriptor. To define a connection between two boxes, ‘GraphLine.Connect’ must then be called.
sub GraphLine.Connect
(
  aGraphLine : handle;      // Connection
  aBoxFirst  : handle;      // Box for starting point of the connection
  aBoxSecond : handle;      // Box for end point of the connection
)
The connection does not adapt automatically if the position or size of one of the boxes is subsequently changed. In this case, ‘GraphLine.Connect’ must simply be called again.
Graph
The Graph object represents the container for the GraphBox and GraphLine objects and is created with the ‘Graph.Create’ function.
sub Graph.Create
(
  aRect     : rect;     // Position and size of the display area
)
: handle;
The display area of the graph is passed in the argument aRect. The ‘Graph.AddBox’ and ‘Graph.AddLine’ functions are used to add the previously generated box and line objects (as overlays) to the graph, thereby making them visible.
The sample database
The download contains the database with the functions described above. The ‘Demo’ procedure creates the graph in Fig. 2 using the functions presented.