The dashboard serves as a tool in controlling and refers to the visualization of information in condensed form. This information is usually presented in graphical form. The aim is to gain insights that enable better operational or strategic decisions with regard to the company’s goals. In today’s article, I would like to discuss the implementation options in conzept 16.
When looking at typical dashboard applications, it is noticeable that they usually contain certain object types. Various types of diagrams, speedometers, and lists are often used to visually represent information and statuses. conzept 16 offers various options for graphically implementing this information.
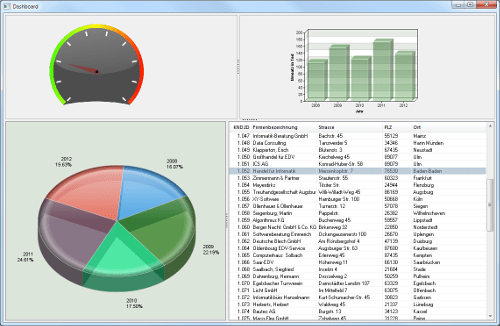 Dashboard application
Chart object:
The chart object is used in conzept 16 to create charts. Various chart types are available here:
- Pie chart (
_ChartPie)
Here, pie charts or doughnut charts can be generated. Doughnut charts are created by additionally specifying an inner radius. - Coordinate diagram (
_ChartXY)
Bar, line, or area graphs can be generated here. - Pyramid chart (
_ChartPyramid)
Pyramid, cone, or funnel charts can be generated here. - Surface diagram (
_ChartSurface)
Surface diagrams can be generated here.
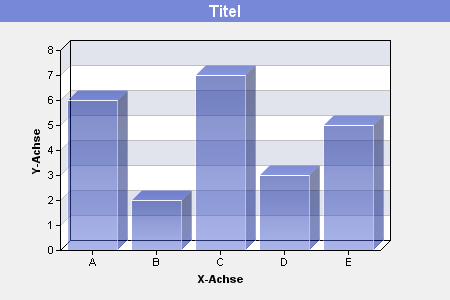 Bar chart
Picture object:
This object is used to display graphics in BMP, JPG, GIF, PNG, TIFF, and ICO formats. This object can be used to display a speedometer that is capable of outputting individual values. It should be noted that additional picture objects can be inserted into a picture object, which are then subordinate to the first object. This is necessary in order to display the speedometer needle. By setting the property wpColBkg of the subordinate object to _WinColTransparent, the content of the parent object is drawn in the subordinate object.
 Sales in Tsd
In the next step, the child object must be able to rotate so that the speedometer needle appears dynamic. To display a smooth rotation, the wpModeEffect property of the child Picture object is set to the value _WinModeEffectRotCustom. The angle in degrees at which the content is to be rotated can then be specified using wpRotation.
The task of a speedometer is to display certain values in a visually appealing way. To ensure that the information is visible at a glance, it is necessary to be able to adjust the labels dynamically. To do this, additional picture objects must be inserted into the parent picture object (speedometer dial). However, these are used exclusively for displaying the values. A string can now be passed procedurally using the wpTextLabel property of the inserted picture object.
Progress bar:
The progress bar can also be used to visually display key figures or statuses. The progress bar offers the advantage that it can be created quickly and easily. By setting a few properties, existing information can be presented clearly.
 Progress indicator for visualizing the system coverage ratio
GanttGraph:
The GanttGraph also offers the option of presenting information in a visual format. The GanttGraph object is not only suitable for displaying time sequences, it can also be used to show actual statuses. In the screenshot below, various box objects have been added to the GanttGraph object for this purpose. These individual objects each represent the current status for each customer.
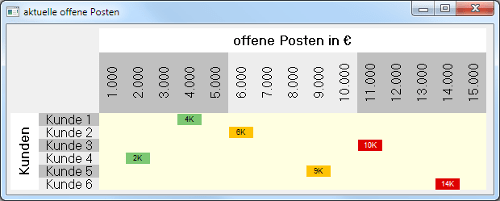 Display of currently open items